DriveIQ
Role: Concept, UXR, UI, MVP
Team: 2
Timeline: 1 Month
Context
India records some of the highest road fatalities globally, driven largely by a "chalta hai" (anything goes) attitude and the psychological use of speed for emotional release. Currently, the driving culture rewards aggressive overtaking and arriving fast, while punishing patience.
Goal
To weaponize the intrinsic competitive spirit of Indian drivers; redirecting their urgent, ego-driven desire to "win the race" into a highly visible, socially validated quest to "master the safe drive.

Problem Statement

Solution
Target Audience

Early 20s
Highly competitive. Requires ego-driven metrics and performance challenges.

Early 30s
Prone to cognitive overload. Needs calming, distraction-free progression

Mid-40s+
Frustrated by rule-breakers. Seeks structured validation for safe habits.
White Paper Research
Why We Start Here?

Establishing the True Hazard
Before we talk to users, we need to know the statistical reality like the fact that over speeding drives the vast majority of fatalities, and that most accidents happen on perfectly straight roads.

Defining Psychological Drivers
We cannot design a behavioral intervention without knowing the underlying psychology, such as how congestion triggers the frustration aggression loop.

Setting UX Boundaries
This phase establishes our hard, non-negotiable UI constraints (like the NHTSA 2-second glance limit for moving vehicles) before we design a single screen.
Primary Research
We validated our foundation by pairing quantitative survey data with qualitative user interviews. This mixed-methods approach allowed us to map large-scale behavioral trends while deeply understanding the "chalta hai" biases driving them, grounding our design in both hard metrics and user empathy.
Quantitative Analysis
65%
The "Chalta Hai" Paradox
blame a careless culture for accidents, but 78% think they are safe. The design must overcome this self-bias.
52%
Self-Competition Wins
prefer beating their own past scores. Social leaderboards must be opt-in to avoid alienating users.
78%
The "Running Late" Trigger
admit rushing alters their driving. The AI must prioritize and heavily weight this high-risk signal.
82%
Privacy = Control
are open to data tracking only if they can delete it and block automatic sharing with insurers.
73%
Progression > Rankings
engage most with "leveling up." Tiered badges (e.g., Bronze to Platinum) are far stickier than competitive leaderboards.
74%
Tangible Rewards Motivate
need real-world benefits (insurance discounts, EV credits) to actually change their habits, not just high scores.
Qualitative Analysis
Micro-Battles > Macro-Stats: Almost all urban commuters (Tiers 1–3) dismiss broad government safety stats as cynical PR. "Epic meaning" falls flat.
Rebrand Restraint as "Mastery": Younger male riders/drivers equate rapid lane slicing and fast reflexes with elite skill. Standard "drive safely" warnings trigger defiance.
Flexible Leaderboards: Tier 1 mega-city commuters feel zero residential neighborhood loyalty, whereas Tier 3/4 and regional drivers display intense collective local pride.
The Horn is for Safety: 6 out of 7 drivers (across all tiers) rely on the horn to survive blind corners and traffic, with only the "Mizoram Exception" finding it rude. Western-style horn penalties will kill app adoption.
Data Collection
What We Actually Need
From CAN Bus /ECU
Speed and acceleration profiles
Steering angle and its rate of change.
Regenerative braking vs friction braking ratio.
Throttle input patterns.
Distance traveled.
From Onboard Systems
GPS/GNSS track (for highway vs. city road context)
Time of day (for night driving risk modifiers)
Ambient temperature
From CAN Bus /ECU
Speed limit data for the specific road segment (requires a map API tie-in)
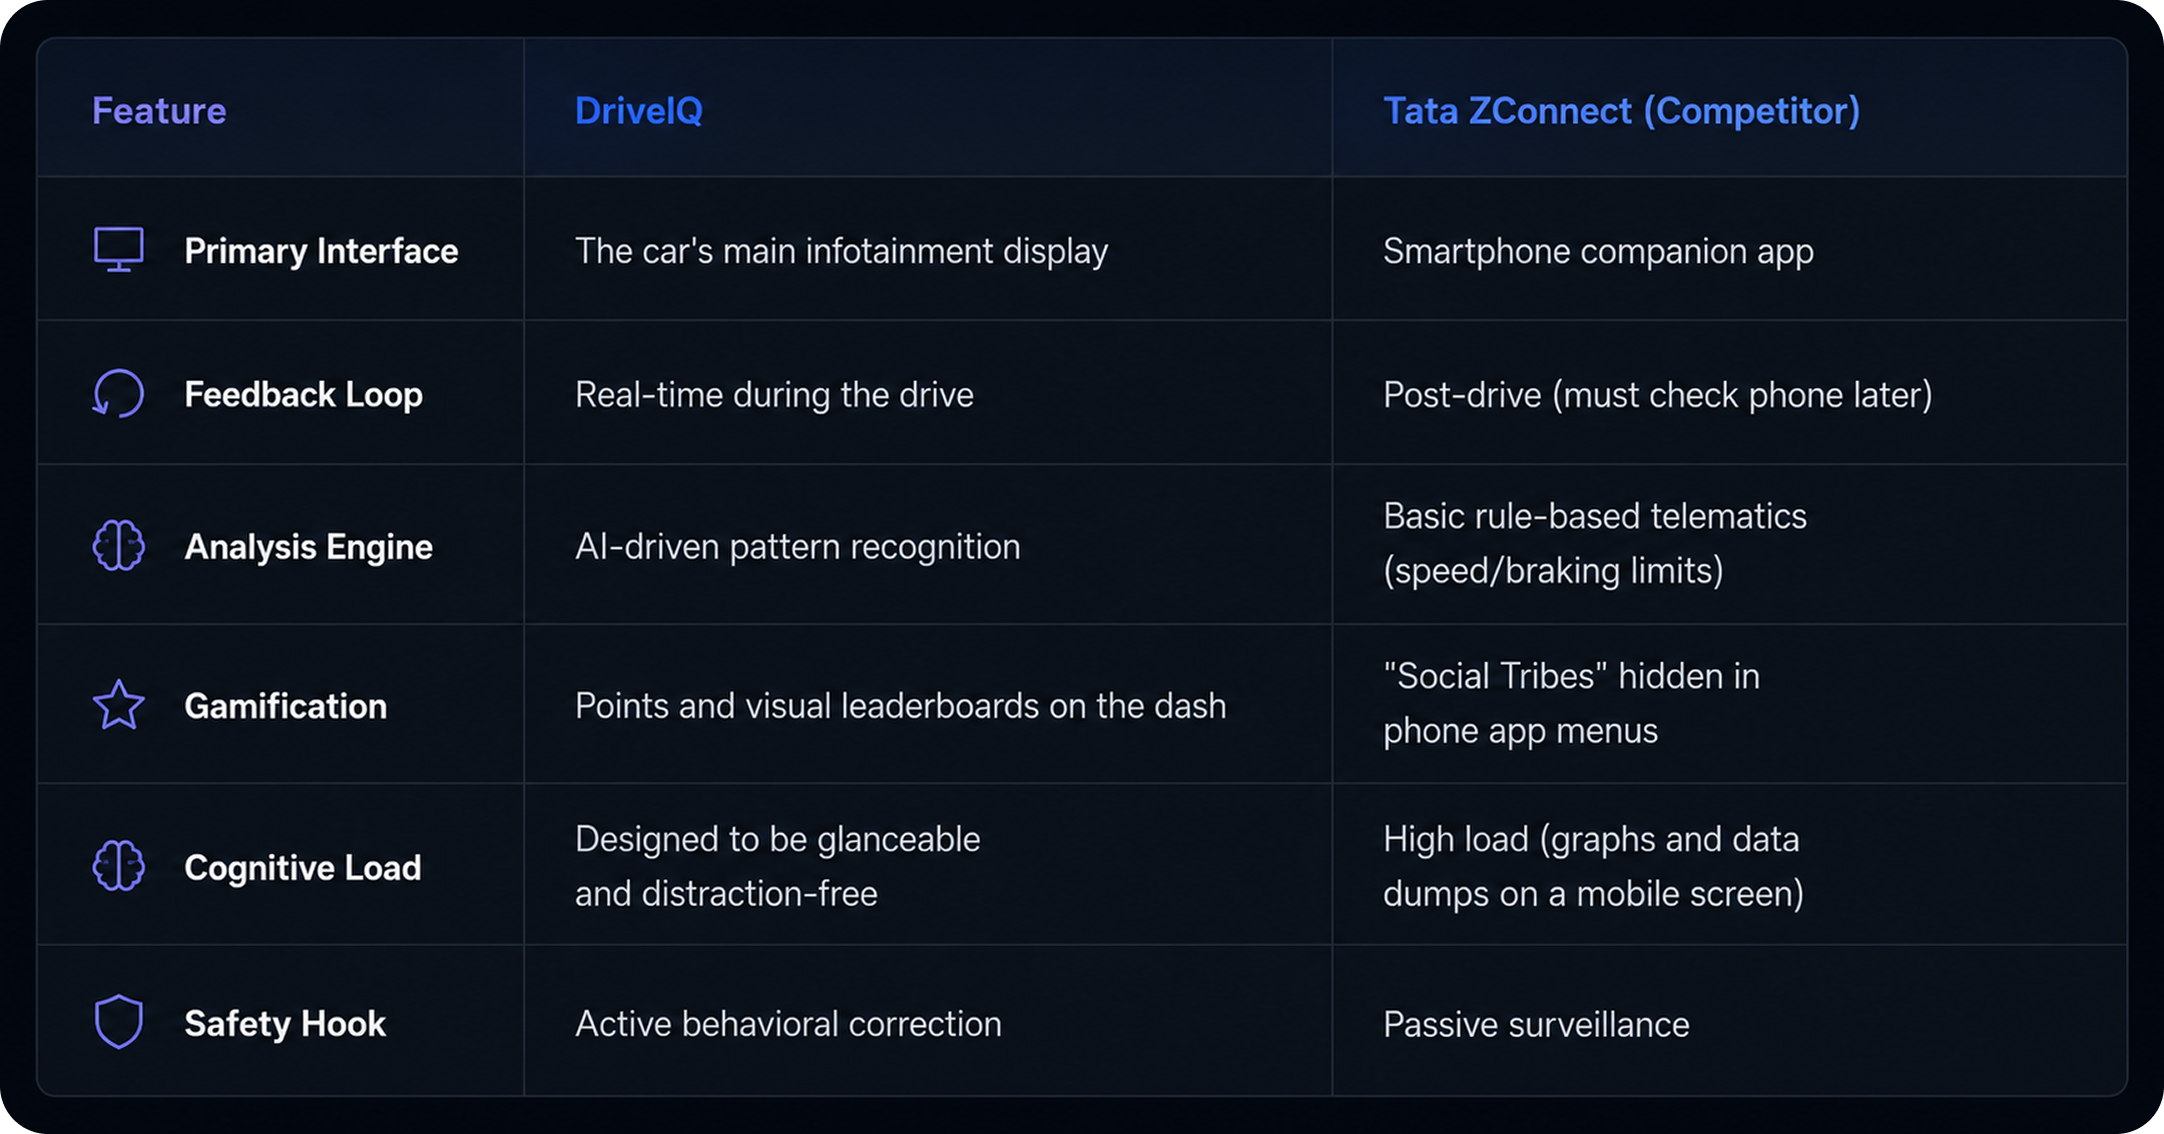
Competitor Analysis
Tata ZConnect is the only sort of competitor in this product segment but its an mobile application with similar features.
User Personas


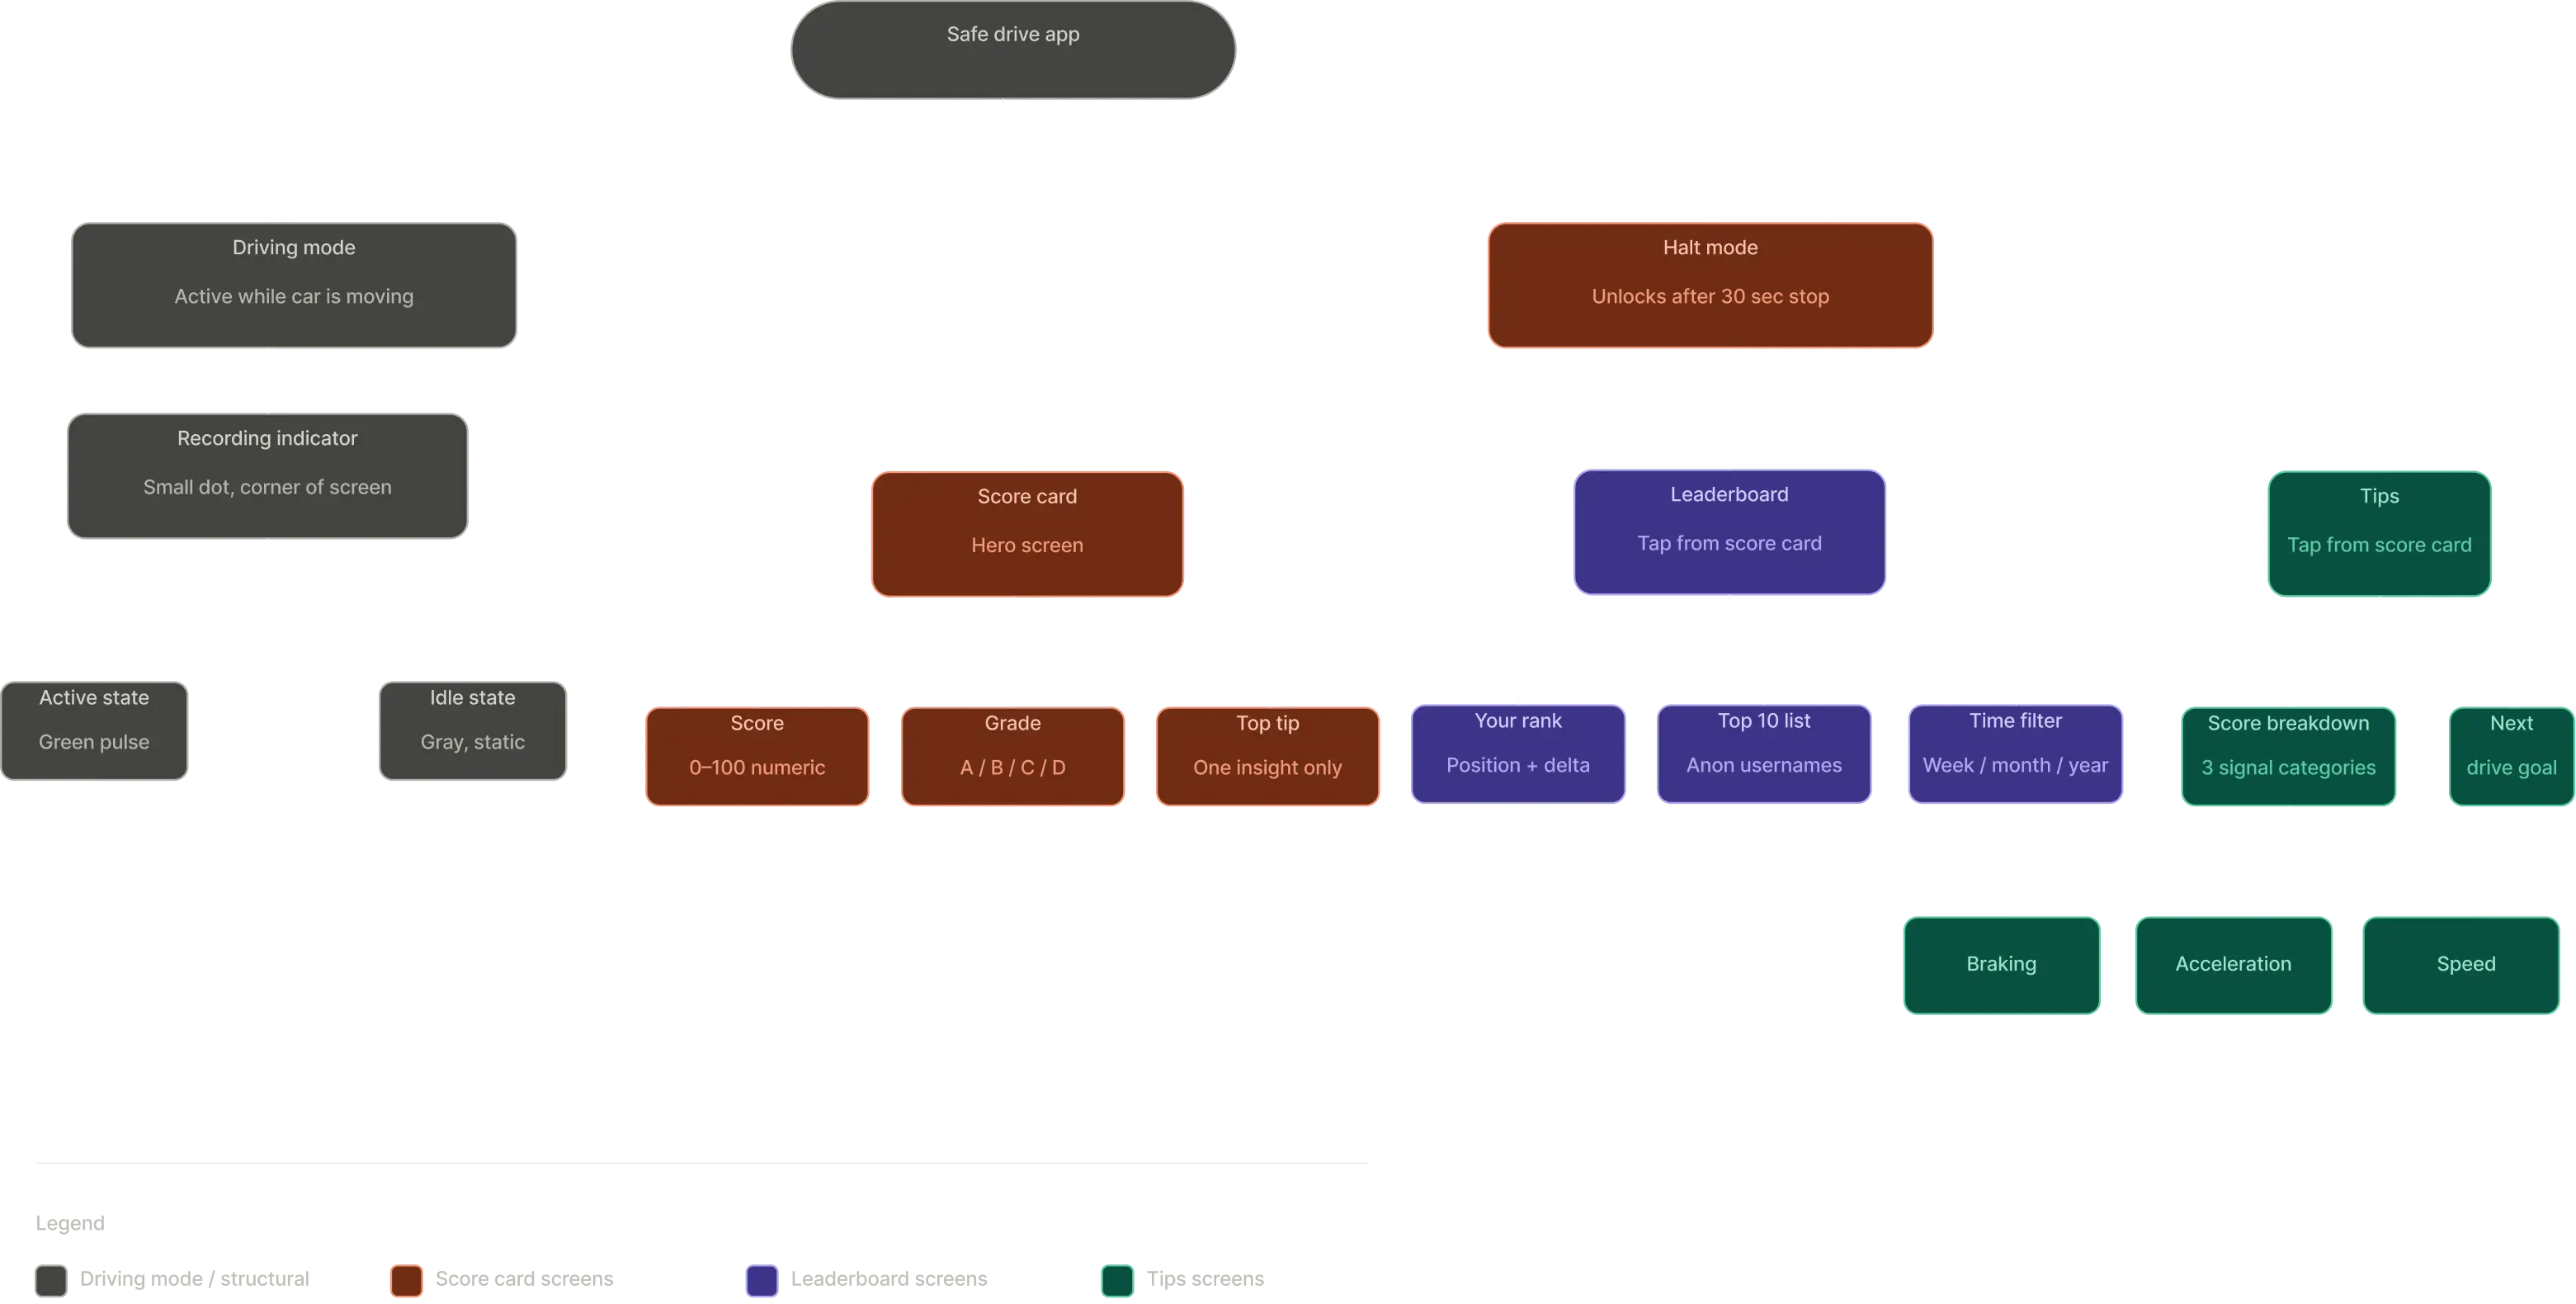
Information Architecture
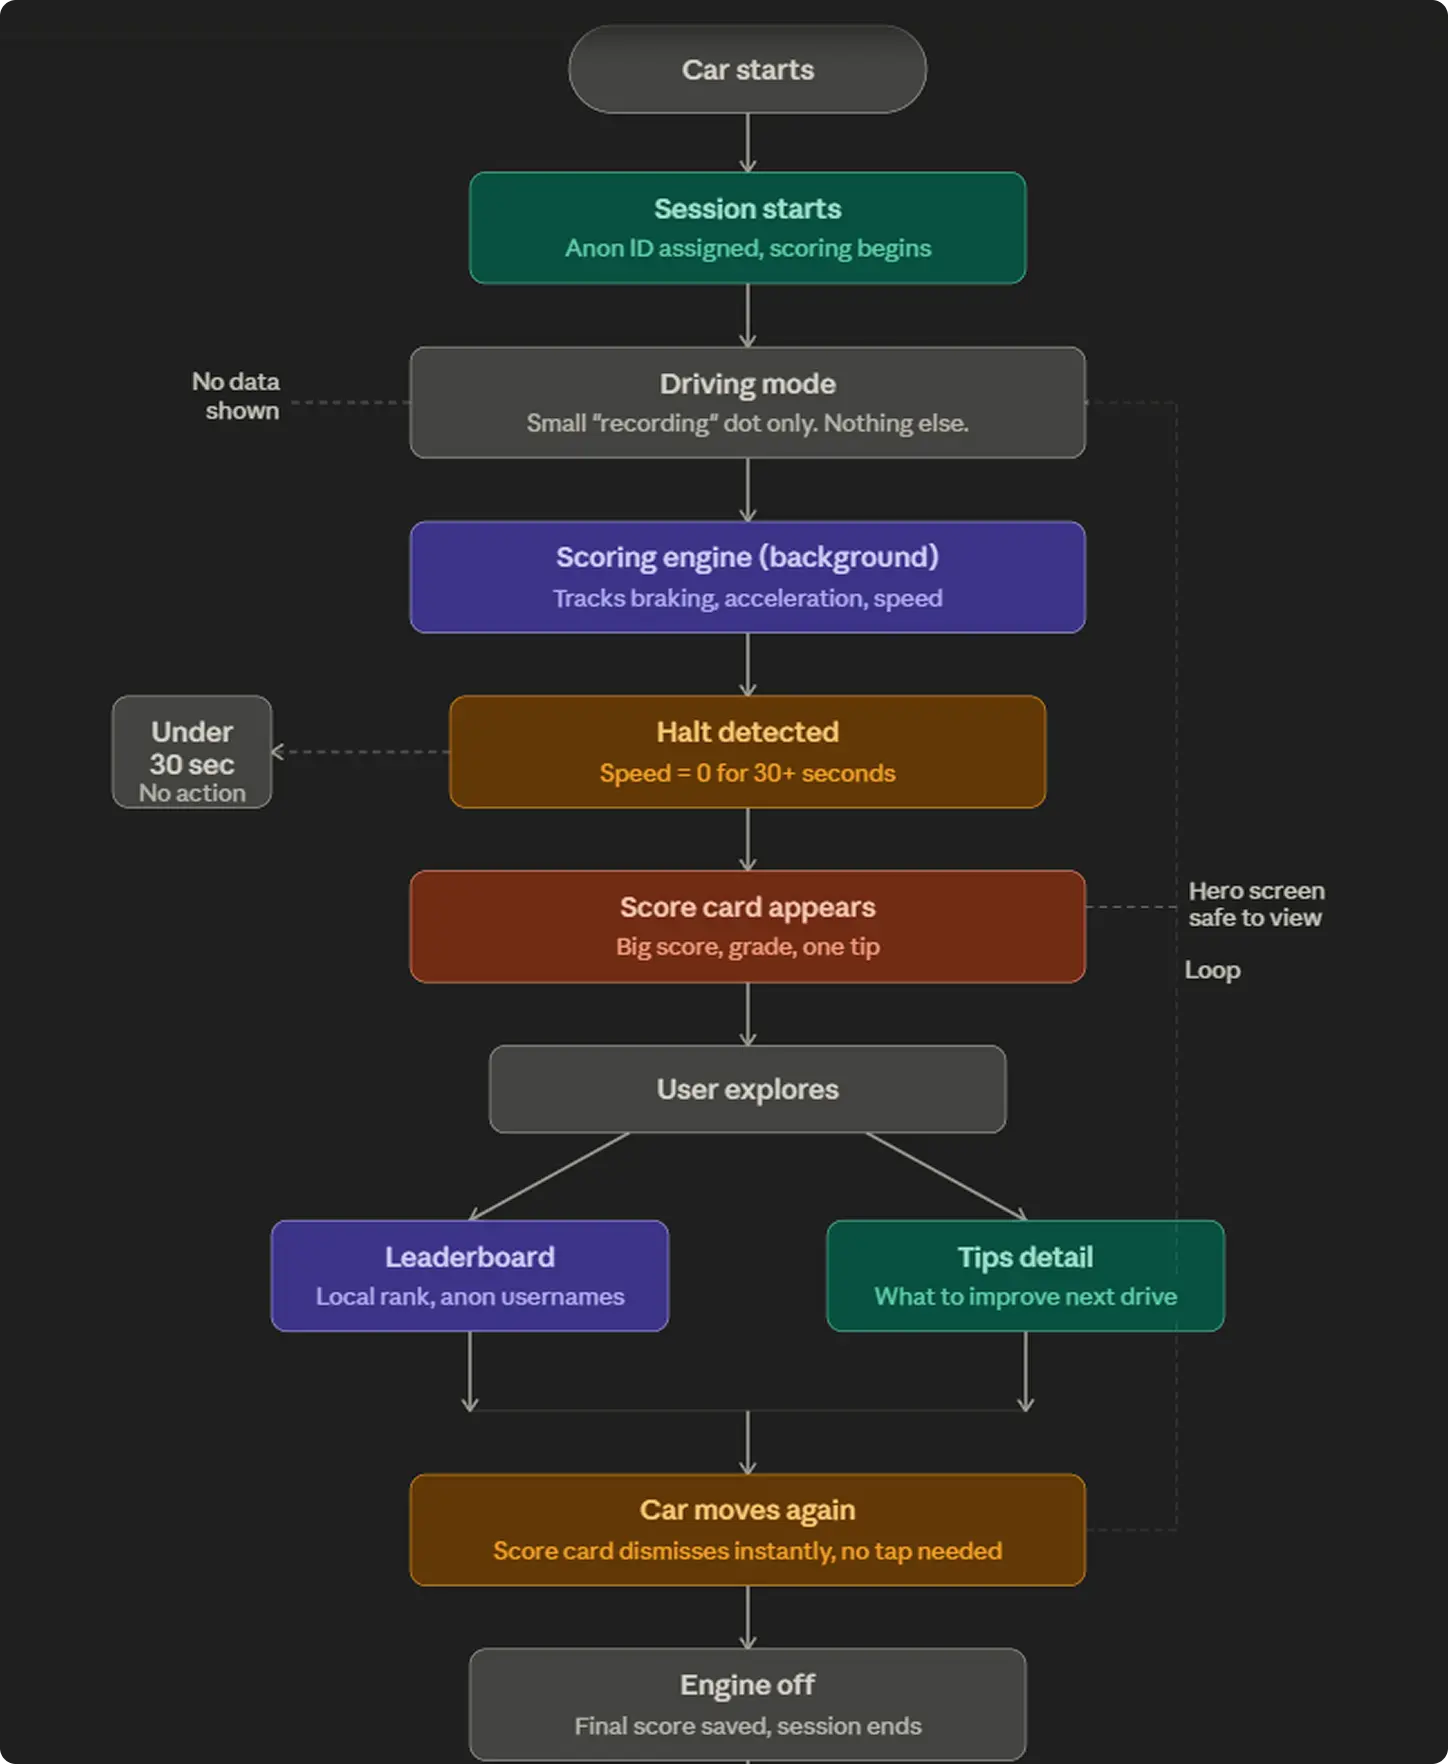
User Flow
Wireframe
Design System
Typography
Roboto
Aa
Font Weight
Light
Regular
Medium
SemiBold
Bold
ExtraBold
ABCDEFGHIJKLMNOPQRSTUVWXYZ
1234567890
Primary Color
Background
#0A0B10
Secondary Colors
Bento
#15171E
NotBlack
#0D0E12
Grey 1
#201F21
Grey 2
#333537
White
#FFFFFF
Accents
Stats 1
#000000
Stats 2
#252525
Stats 3
#373737
Stats 4
#747474
Stats 5
#626262
Daytime
#F1F1F1
Nightime
#FAFAFA
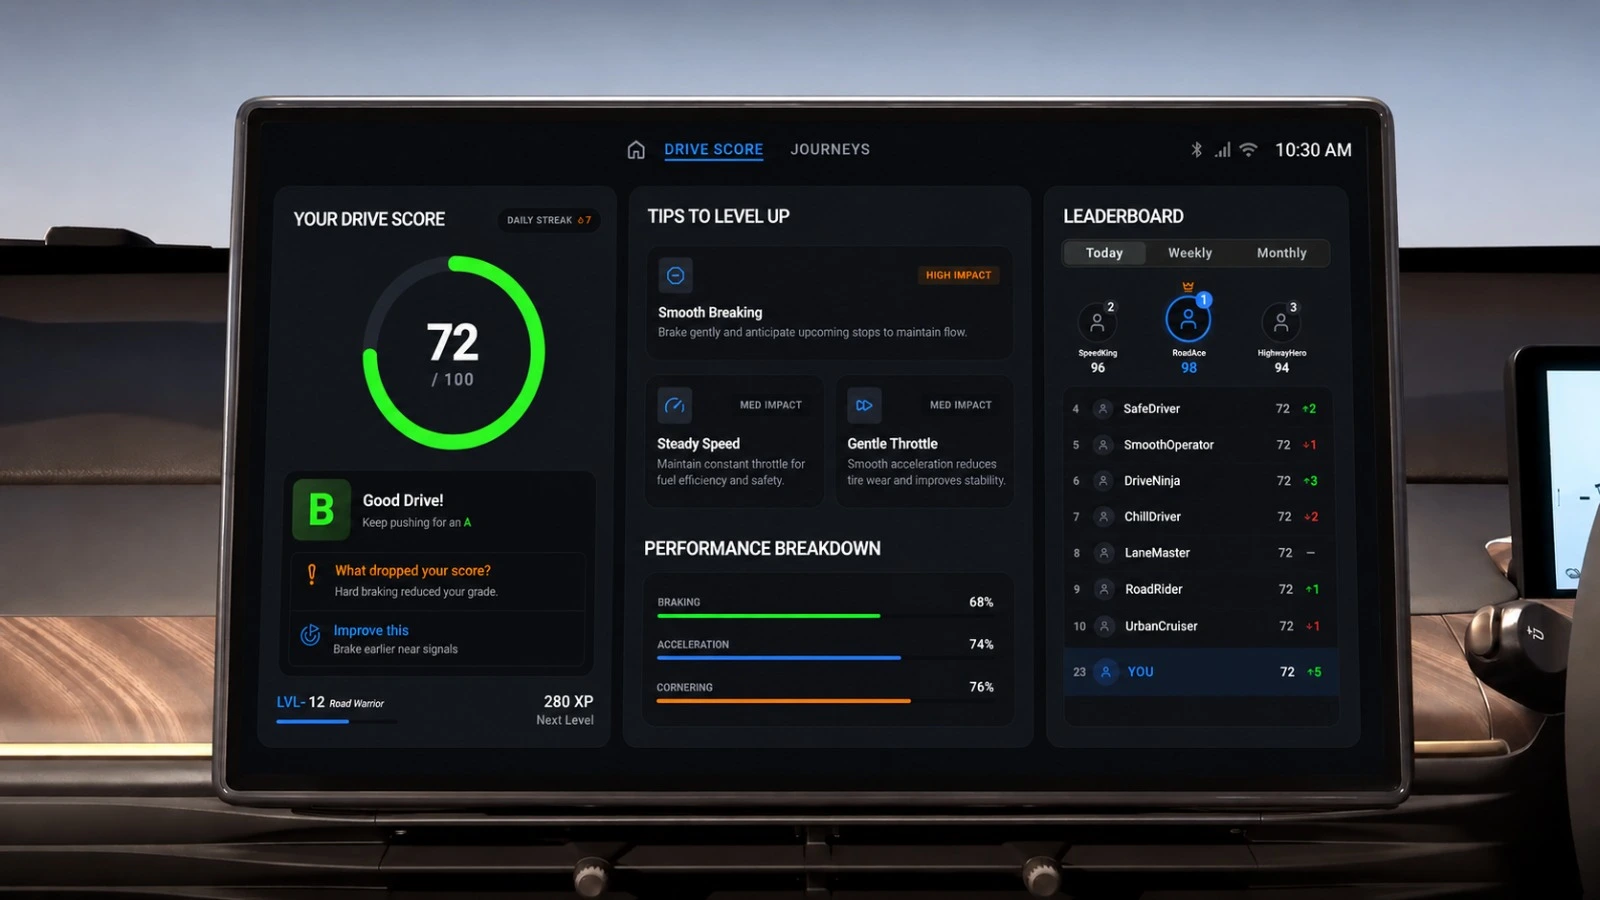
High-Fidelity Screens
Limitations
What we need to look out for?

Technical Feedback Lag
To keep hardware affordable on mass-market cars, heavy data processing must be offloaded. This introduces a 30-to-60 second sync delay post-drive, which disrupts the immediate, gamified dopamine hit.

The loop hole
Currently there is no feature to track the cars around the users, to detect illegal lane changes or rash cuts, but the speeding and breaking checks should help with this resionably.

Gaming & Distraction
Competitive users might obsess over a perfect score, leading them to drive unsafely slow or block fast lanes.
Feature List
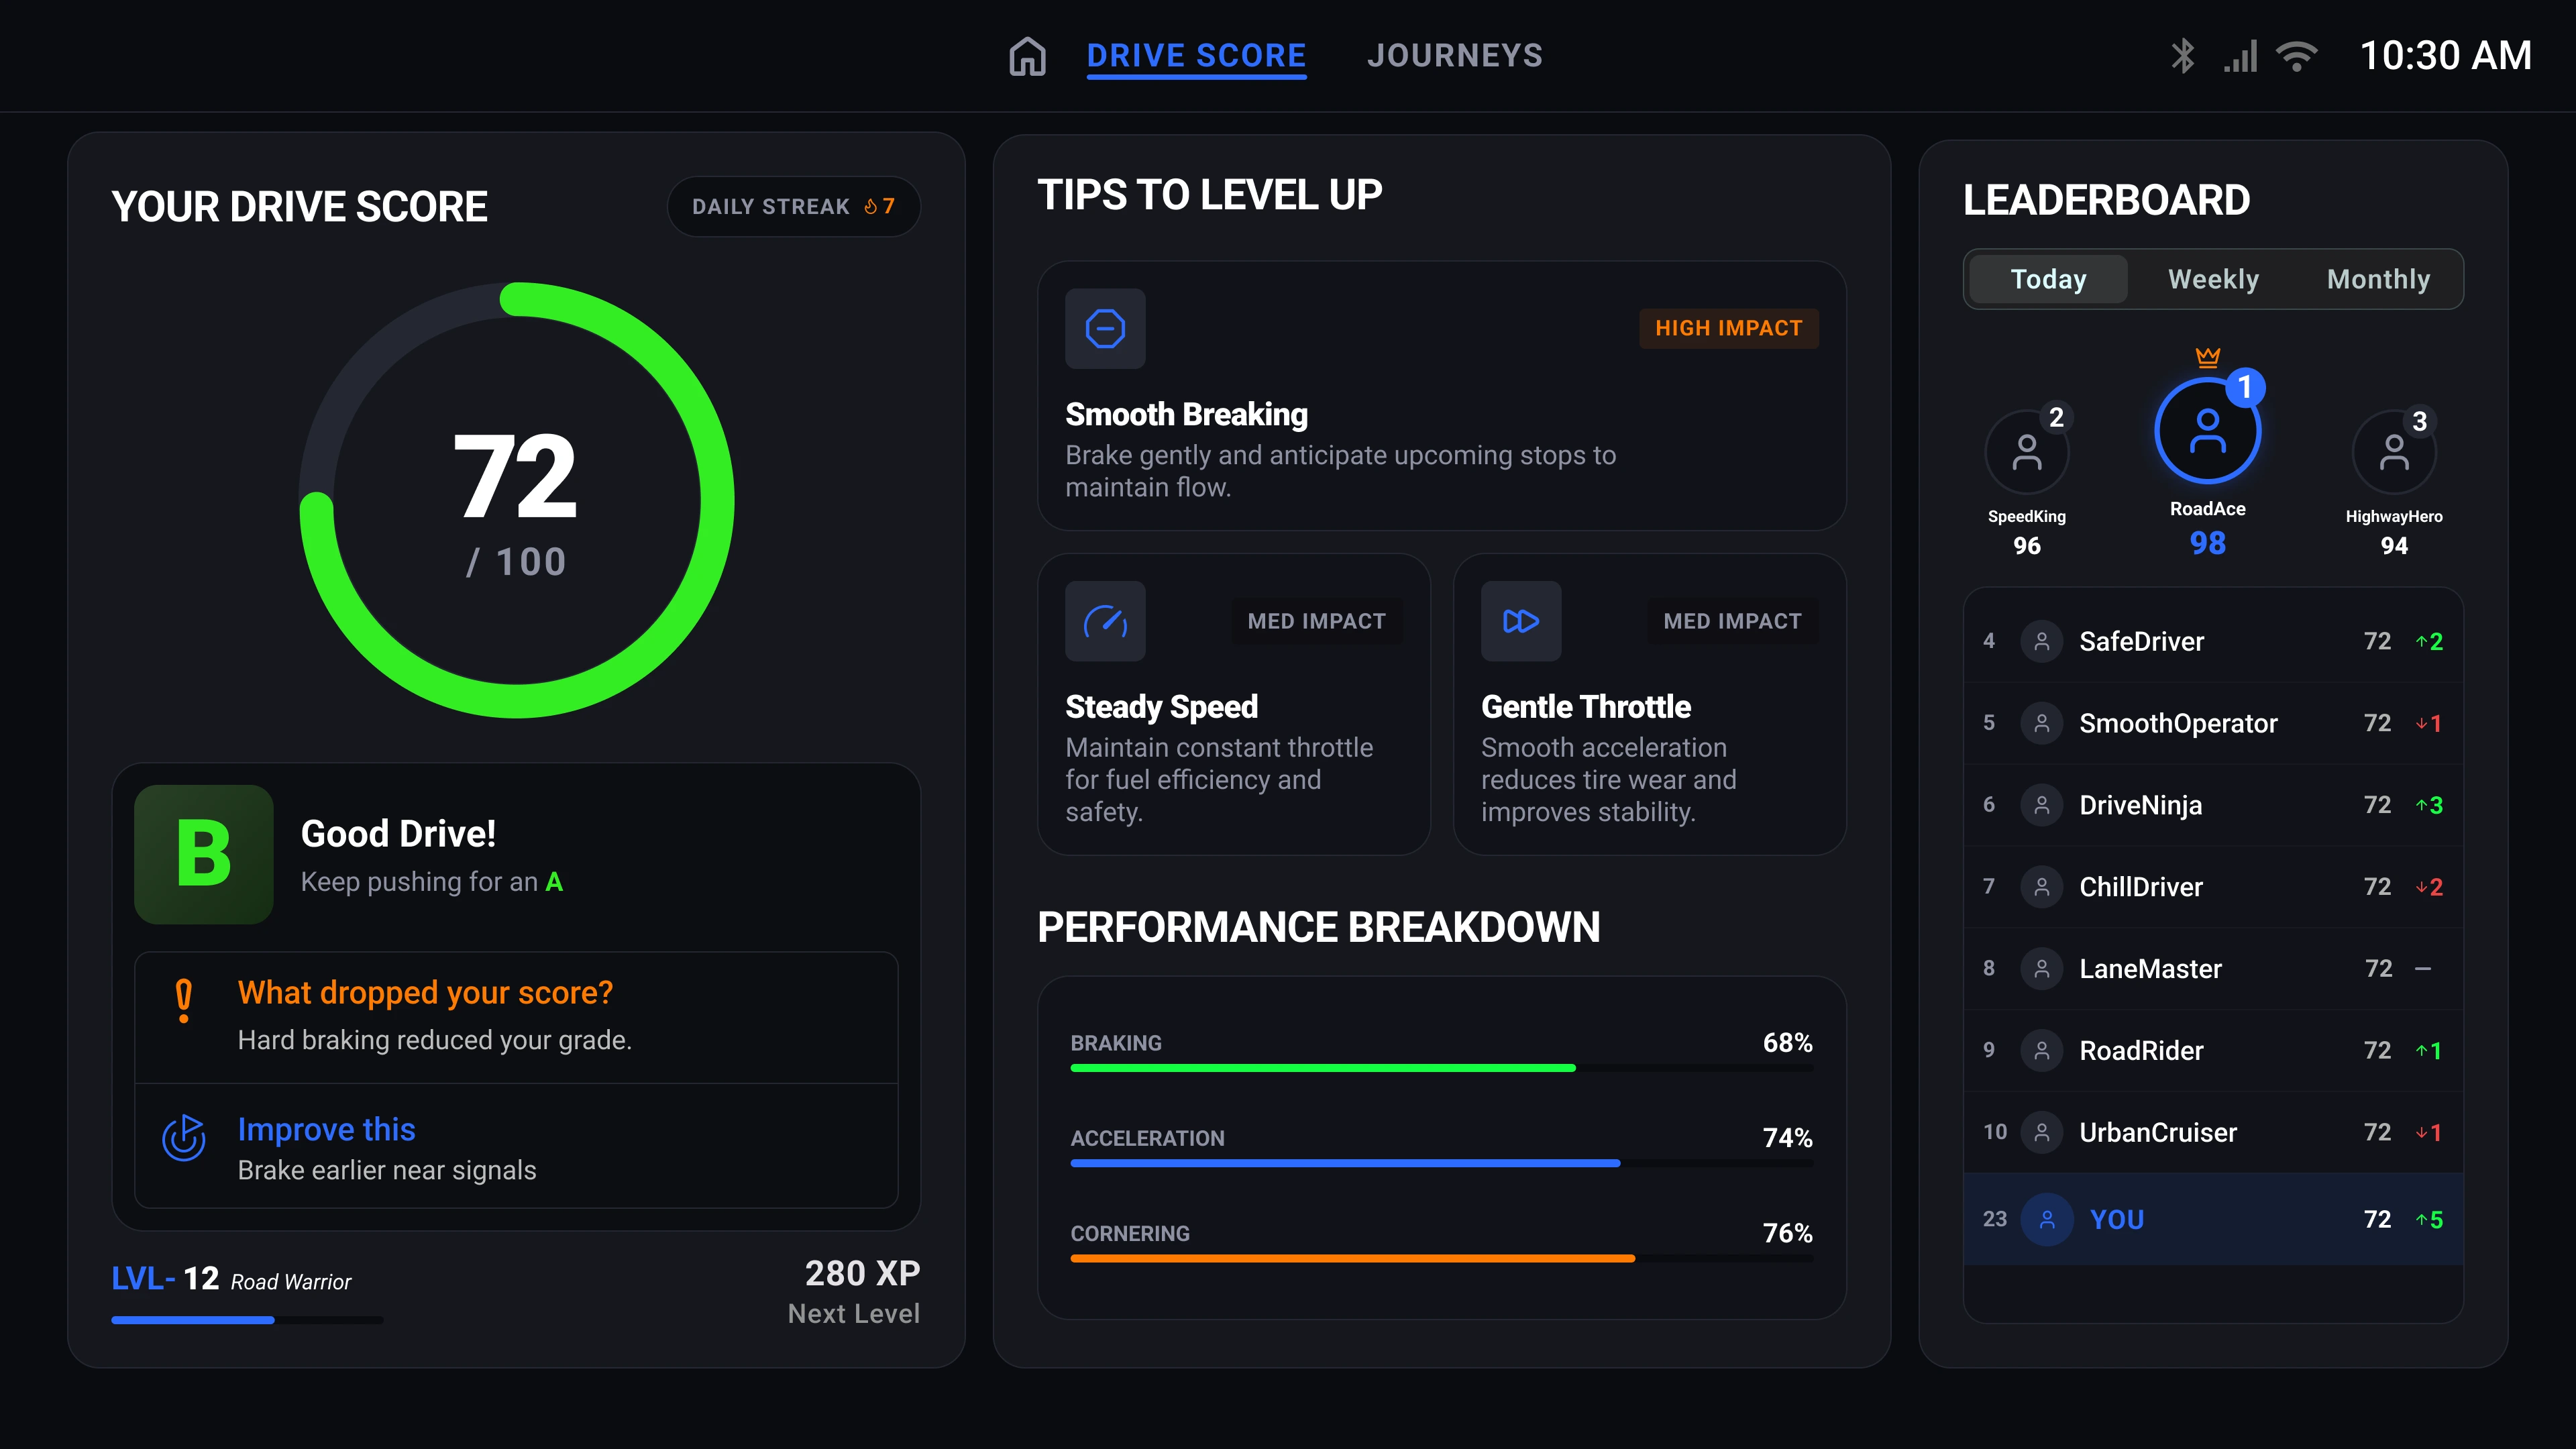
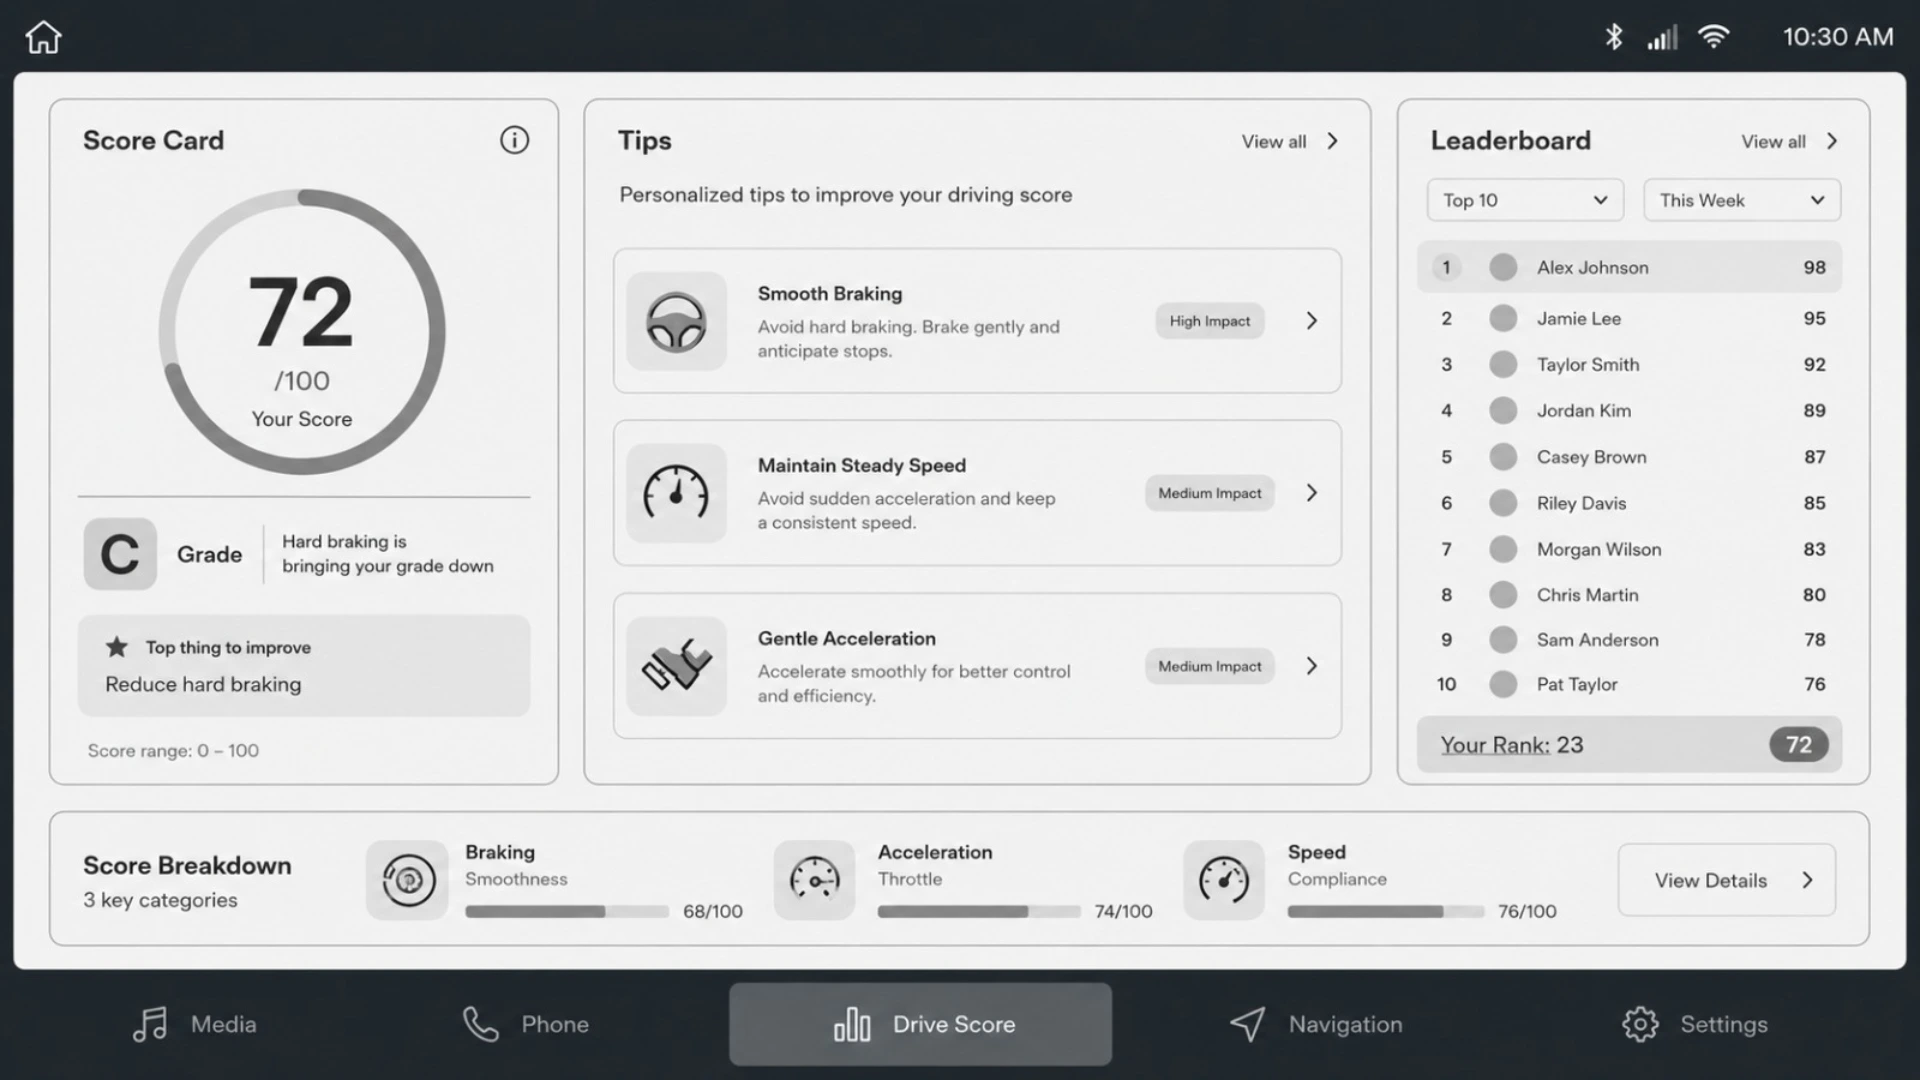
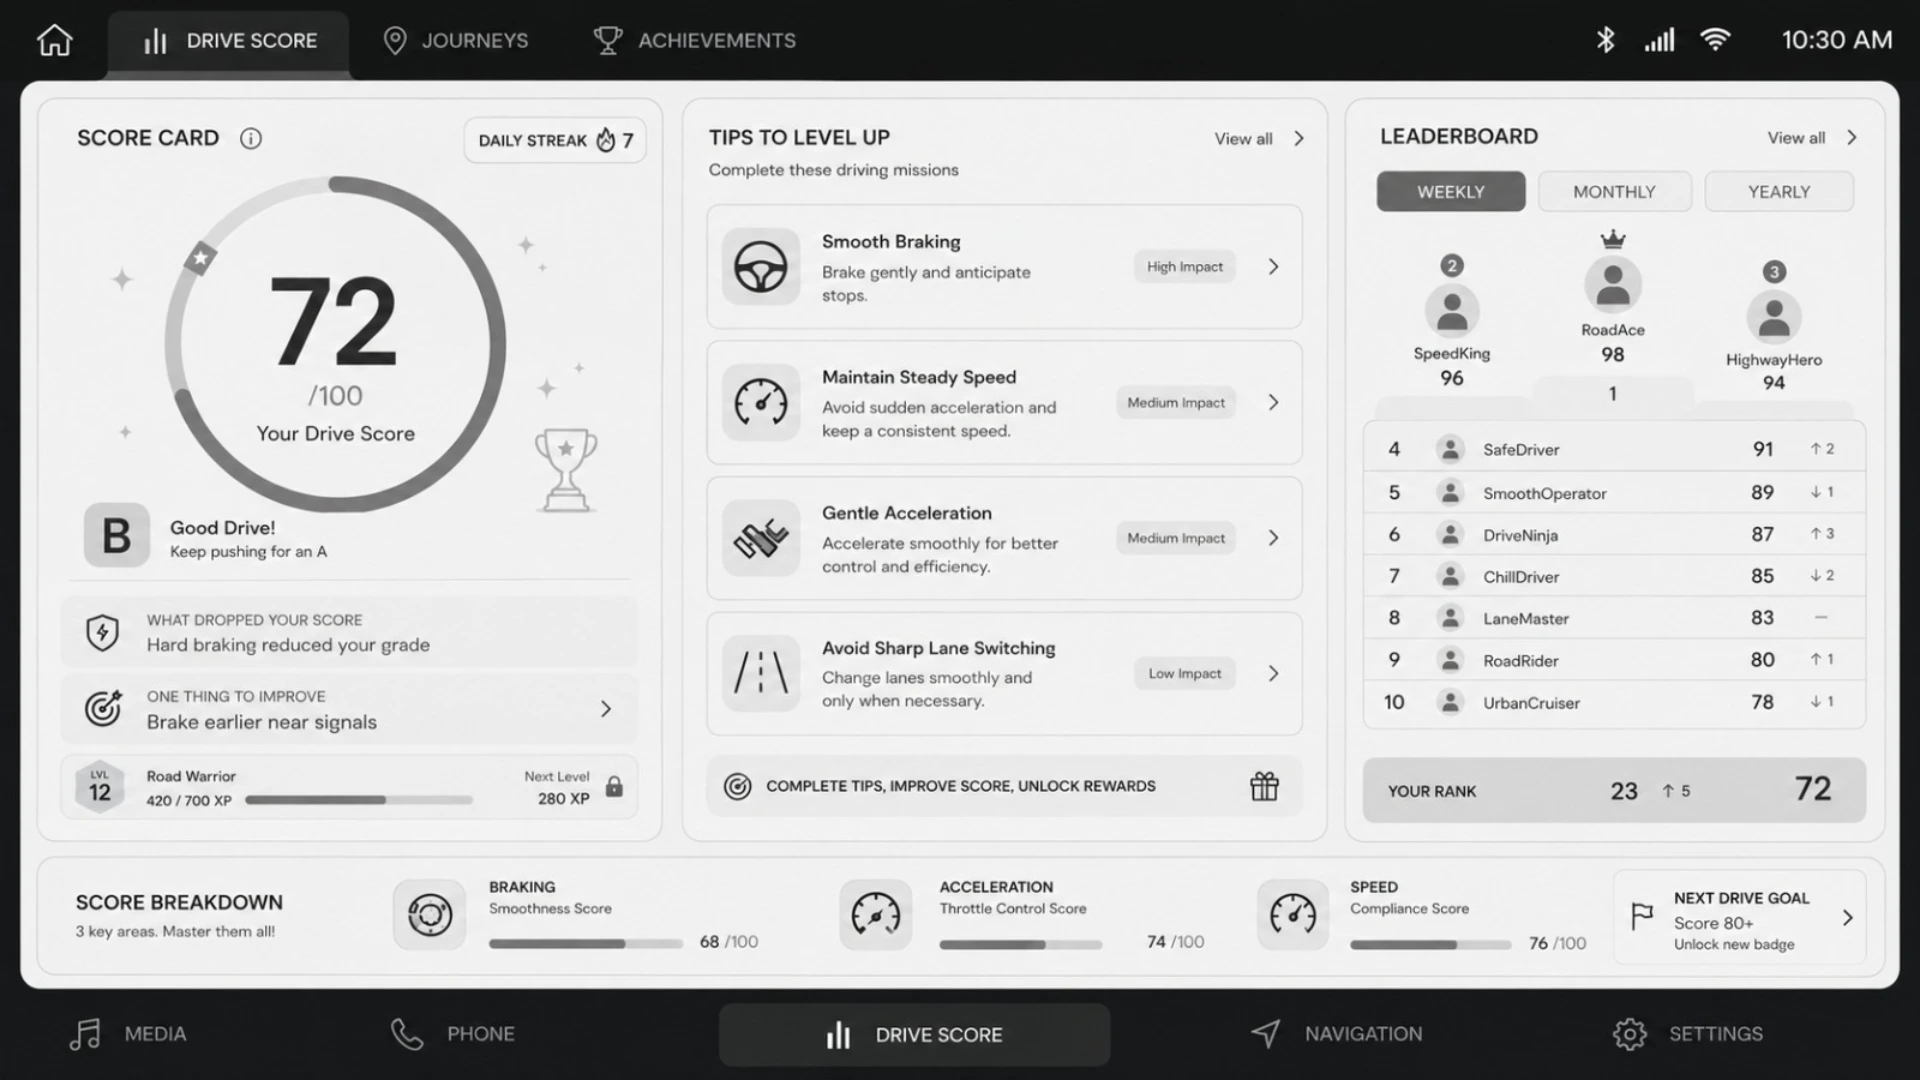
Driver Score
Real-Time Drive Score: Live circular 0-100 progress tracker.
Daily Streak Counter: Gamified daily engagement tracker.
Letter Grading System: Instant visual grade and tier motivation.
Contextual AI Insights: Pinpoints score drops and exactly how to fix them.
RPG-Style Leveling: User level, title, and XP required for the next rank.
Tips To Level Up
Impact-Weighted Tips: Tagged advice showing direct impact on your score.
Metric Breakdown: Visual percentage bars for key driving behaviors.
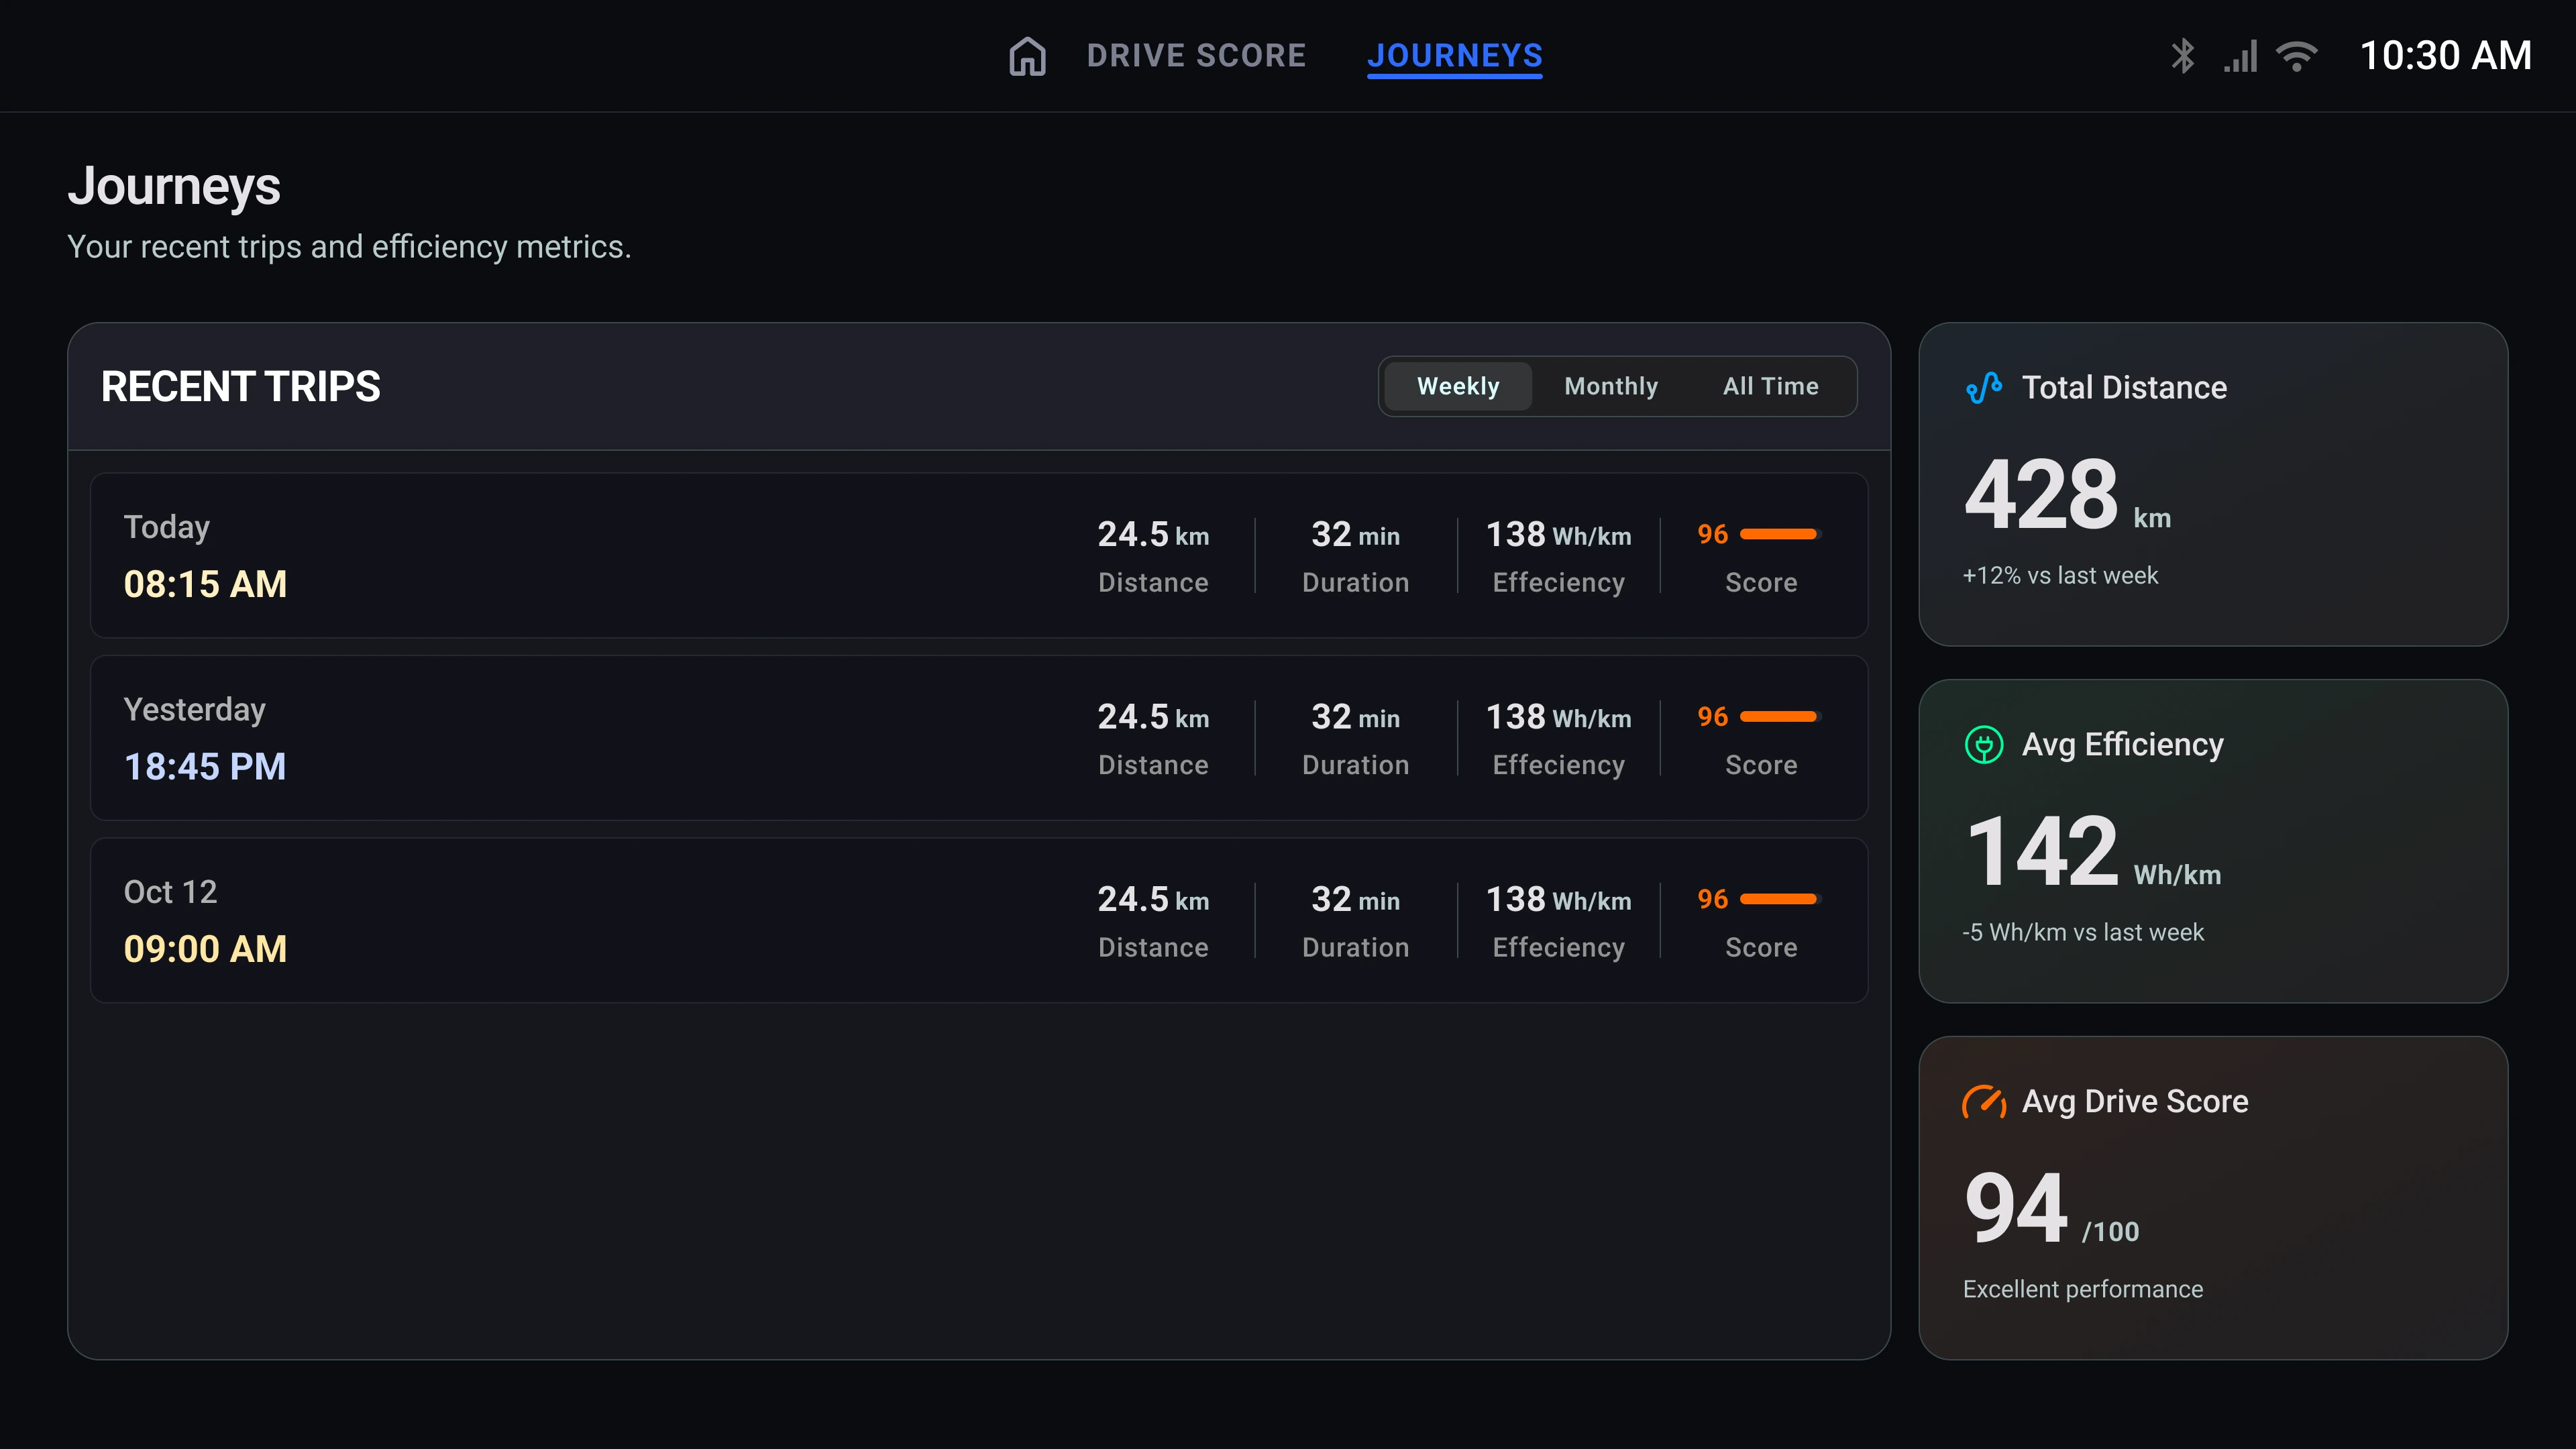
Leaderboard
Top 3 Podium: Avatars, names, and scores of the top three leaders.
Competitor List: Scrollable ranks with live trend indicators.
Pinned User Status: Persistent view of your personal rank and momentum.